register_link

Blog Archives

Do playlists destroy the fan-artist connection?

What you'll learn in this post:
  • What it means when the song and not the artist is the star
  • What influence playlists have on the artist-fan relationship
  • Why there are fewer and fewer top hits but more one-hit wonders

No one can deny the importance of playlists. Many listeners consume music mainly through playlists and discover new songs this way. For the artists, they are a tool to increase their streaming numbers and stimulate the algorithm. Some experts, however, are of the opinion that playlists have a negative impact on the connection between fan and artist. We’ll show you why.

The song is bigger than the artist

Many of the top hits today first go viral on TikTok and only then make their way into the big playlists where they accumulate millions of streams. Many of these artists are unable to follow up that success with their new releases. This is not only due to the short-lived nature of TikTok trends, but also the fact that a spot in a playlist doesn’t automatically mean a massive growth in the fanbase. Or, to put it in other words: Nowadays, the song often gets a bigger spotlight than the artist.

A prime example for this are the numerous LoFi producers who have millions of streams but whom no one would recognize on the street. Their success is based on playlist placements but very few people actually care about the artists behind the songs. While this might be an extreme case, more and more listeners do consume playlists without really knowing who they are listening to, much less engaging with the artist and their discography.

An artist can take the charts by storm with one song, and get swallowed up in the sea of uploads with the next. When the song is bigger than the artist, the result is an enormous dependency on playlists and a total lack of planning reliability. It is important for fans to have a connection to the artists. But these rarely happen with playlists. The listeners choose their playlist based on their current mood and proceed to listen to the music passively. Since around two thirds of music is consumed through playlists, this effect should not be underestimated.

Less top hits – more one hit wonders

The trend can also be observed in the charts: There have never been as many different songs passing through the billboard charts as they did over the course of 2020. This underscores another analysis which shows that there are fewer and fewer true top hits today. The biggest hit in the first half of 2021 was “drivers license” by Olivia Rodrigo with 460.2 million streams. That’s a significantly lower number than what the biggest hits of previous years received within the same timeframe (Roddy Ricch’s “The Box” in 2020 with 727.7 and „Old Town Road“ in 2019 with 596.1 million streams).

So, while streams are continuously increasing, the megahits generate fewer and fewer of them. If we look at the top ten most streamed songs, we can observe a plummeting trend here, as well. The number has been sinking for the past two years and is now on the level it was at in 2017, when the total streaming numbers were 80% lower than they are today. To conclude, there are more and more songs that only go viral for a short period of time. And while the social-media-playlist bubble is jauntily producing new one-hit wonders, the number of artists with sustainable success is sinking.

Reduce dependency on playlists

Of course, you should still try to get your songs into playlists – big and small. But what’s even more important is to build a solid fanbase and garner a lot of followers, so that a song can still perform well even when it is not considered by the important playlists. Many artists are trying to decrease their dependency on playlists by looking for other sources of revenue, be it monetizing their catalog, generating money through Twitch, Patreon, or other platforms, or by trying their luck with NFTs

YouTube crash course: Everything about the algorithm, analytics and how to optimize your uploads

What you'll learn in this post:
  • How YouTube's algorithms work - and how you can make them work for you
  • How you use analytics and turn them into tangible optimizations
  • How to spread your upload as much as possible

YouTube is one of the most relevant platforms for musicians. But getting reach on YouTube can be tough. Learn how to make the most of the video platform in this article.

YouTube is one of the most relevant platforms for musicians. In order to reach a large audience with music videos, the video platform is basically the only choice. However, as with any other social medium, various algorithms work in the background to decide which content is suggested to users. A basic understanding of YouTube’s playout mechanisms can therefore give musicians and managements a significant edge in the placement and evaluation of their own productions.

YouTube’s algorithms

Google, the corporation behind YouTube, keeps its content algorithms top secret and in constant flux to avoid being cracked or circumvented. Nevertheless, resourceful analysts repeatedly manage to analyze the behavior of these algorithms through trial-and-error procedures and the evaluation of best-practice examples and therefore identify the decisive factors for the success of a video.

Besides the subscription box there are three important ways users can come across your videos: The search engine, recommendations of similar videos, and the home page. Each of these is based on a separate calculation process that decides how prominently a video is played and where it is recommended based on factors such as views, average play time and viewer demographics. These factors are called key performance indicators or KPIs for short.

The most important KPIs

Some of these KPIs are particularly relevant: The click rate for example, shows how many people click on your upload and take at least a brief look at the video. A high watch time indicates that viewers are watching the video for a while. Many interactions in comment columns and ratings are also welcome. How your video performs in the various aspects determines how and to whom YouTube suggests the video. Below you’ll learn more about the crucial KPIs and how to evaluate them.

Tools you should use

In addition to video uploads, YouTube offers a variety of features that you should take full advantage of. Because videos are not the only way to connect with your subscribers and those who might become subscribers. For this there is the community tab, where you can promote external links or refer to upcoming projects. YouTube stories basically work like they do on other socials. The same applies to the #Shorts, so to say YouTube’s TikTok or Reel function. However, this feature is still in beta and will be rolled out gradually.

The specific algorithms that YouTube works with are top secret and change regularly. On the one hand in order not to become too comprehensible, on the other hand in order to optimize the user experience – because at the end of the day, Google is all about the viewers, who should spend as much time as possible on YouTube. Their own user behavior also plays a strong role in the playout.

Analytics

YouTube’s analytics offer comprehensive insights into the performance of your uploads, the audience you reach, the traffic sources and much more. Keeping an eye on your analytics and targeting them can give you valuable information. This information will help you, to schedule your future uploads, prepare them for your audience and tag them in a meaningful way. By the way, iGroove also offers you comprehensive analytics tools for your streaming data – so you can keep an eye on the performance of your songs and push for the best possible results.

Impressions

The first contact with viewers is already made through the thumbnail and the title of your video. Below you’ll learn how to design these optimally. But as soon as someone scrolls by and sees your video, even without clicking on it, the upload creates an impression, i.e. a contact. Many impressions are good and important, but they don’t bring traffic – the video has to be clicked and watched for at least 30 seconds.

Click rate

The click rate represents the ratio of impressions to views. If 5 out of 100 people who stumble upon your upload watch at least 30 seconds of the video, the upload has a click rate of 5% – a slightly above-average value, by the way. A low click rate is probably due to an unflattering title or thumbnail, but can also be due to your video being suggested to the wrong people. That can be greatly optimized by yourself. More on this later.

Watchtime & Interaction

Once viewers have landed on your video, it’s important to keep them there and encourage them to interact. YouTube’s algorithms favor uploads that don’t close quickly. If many people watch your video until the end, the algorithm concludes that it must be something particularly interesting and plays it generously. If many users write comments or rate the video, YouTube also favors the video enormously, since it is obviously particularly exciting or polarizing content.

Demographics

YouTube tells you a lot about your viewers. Especially age, gender and location are relevant values. Knowing your audience allows you to cater to their needs and behaviors. If you know what time of day your viewers are most active, you can time your uploads precisely. Knowing your fans can also help you plan your merch production, for example, if you derive the size key from the demographics of your audience. If you have a particularly large audience in a particular city, make a tour stop there.

Access sources and behavior flow

Knowing the sources of traffic to your videos is also a key advantage. Not getting much traffic via the subscription box? Communicate more with your subscribers via the community tab, set up future premieres if necessary. Instagram brings you a lot of traffic? Good to know, maybe you should advertise there or directly post the YouTube link instead of the streaming link to your new single. The playlist in your endcard isn’t getting clicks? Add another single instead.

You should definitely look at your YouTube analytics on a regular basis and put the different KPIs in perspective. What’s doing well? What’s going badly? Optimization works through constant observation, evaluation, and trial and error. While music videos offer less room for maneuver than other content, drawing the right conclusions from your analytics can help you tailor future uploads much better to your audience and content.

Meanwhile, you’ve learned how YouTube’s content algorithms work and how to evaluate your analytics to optimize future uploads. To do this, you need to know your audience and understand how your own content works. If your analytics show that you’re getting a lot of views from another rapper’s video recommendations, it might make sense to target their fans in the future.

The channel

To begin with, you should make sure that your channel is well presented. The first thing visitors see is your header and welcome video. You should make sure that your header is appealing. Note that the graphic scales depending on the device. The welcome video is your current upload by default. You can also provide a dedicated video that introduces you. In the customize section, you can set a watermark, link your socials, and set a custom channel URL. It’s also important to set appropriate tags for your channel.

The keyword

The center of YouTube SEO are the tags. These are keywords that YouTube uses to rank your upload. A tutorial on how to mix a rap song should clearly focus on the keyword sequence “mix a rap song” – people search a lot for that, and YouTube can do a lot with the info about the video’s content. Variations like “mix hip hop song” can also be helpful for findability. You can check which phrase you should put your focus on in Google Trends – there you can check the search volume of your keywords.

Title and thumbnail

The most important keyword should be placed at the beginning of the video title. For music videos, this is usually the name. The title format for music videos is more or less standardized – you can’t go wrong with the format “Name – Song Title (Producer)”. Formulations like “Official Video” hardly play a role anymore. The fact that it is a video should be seen at first glance in the thumbnail. The single cover is therefore usually not very suitable. In addition, people should be able to recognize you immediately – small details are taboo!

Description

Your keyword should also appear frequently in the video description, which can contain a lot of text. 2-3 times per 100 words would be optimal. The more a term appears at the front of the text, the more relevant YouTube considers it to be a keyword. This also applies to the video title. You can also link related videos that you want the algorithm to associate your upload with in the description. Hashtags you use in the description will appear above the title.

The tags

The tags themselves are not valued as much by YouTube as they were a few years ago. Now, keywords in the title and video description, as well as the behavior of your viewers, are much more relevant. Still, you should tag your uploads properly. Depending on your strategy, you can spread your tags widely to inform YouTube comprehensively about the content of your upload, or you can use tags sparingly – this is usually more profitable. Many tags dilute the most relevant terms, so the algorithm can’t know exactly what to focus on.

Preparing your YouTube upload in the best possible way can make the difference between winning and losing on the video platform. With our crash course, you now have the tools you need to navigate the video platform jungle.

Do you want to give your video an extra boost? With our effective YouTube advertising, we give you the opportunity to reach numerous new fans and generate additional views.

YouTube Shorts now available worldwide

What you'll learn in this post:
  • YouTube rolls out its short video format Shorts worldwide
  • How YouTube Shorts works and how music is used
  • How Content ID comes into play

While TikTok only recently announced that they will be increasing their maximum video length to three minutes, YouTube has launched a copy of TikToks short-form videos called YouTube Shorts. This new format has been tested for quite some time first in India and later in the US. Now, it will be rolled out in more than 100 countries and will thus be available anywhere YouTube is available. With Shorts, YouTube wants to give musicians and other creators another way to connect with fans directly.

How does YouTube Shorts work?

Similar to TikTok, you record the video directly on your smartphone, upload it, and then edit it whichever way you want. Of course, you can also add music to your videos. The standard length is 15 seconds, but you can also change that to 60 seconds. However, audio content from the Audio Library can only be added to the 15-second videos. In addition to songs from the Audio Library, you can also use audio content from YouTube videos. More information can be found here.

Content ID also for YouTube Shorts

As an artist, you should know: The Content ID is applied to YouTube Shorts, as well. This means that if someone uses your song, it will be recognized by the Content ID. If you have set up your Content ID via your distributor and selected the “block” option, then those videos will be removed. As soon as ads also show up on YouTube Shorts, you will be able to share in the revenues via the Content ID whenever your song is used in a video.

YouTube Shorts Fund

For the creators, YouTube has set up a $100 million YouTube Shorts Fund. However, you cannot apply for it yourself; instead, YouTube will directly approach the creators who post content that they deem interesting and that is viewed by many users. Additionally, YouTube promises to work on other monetization options, as well.

Which short video services are establishing themselves?

YouTube is clearly feeling the pressure from TikTok, even more so after a recently released study showed that users in the US and UK are spending more time per month on TikTok than they do on YouTube. It will certainly be interesting to see whether the market will be big enough for TikTok, Triller, Snapchat, Reels, Shorts, and various other short-form video options. It is well possible that only some of them are able to establish themselves long-term while others are quietly abandoned.

Streaming subscriptions are growing more than ever before

What you'll learn in this post:
  • Spotify has by far the most subscribers
  • But YouTube Music is seeing the greatest growth
  • Revenues increase significantly less than subscribers

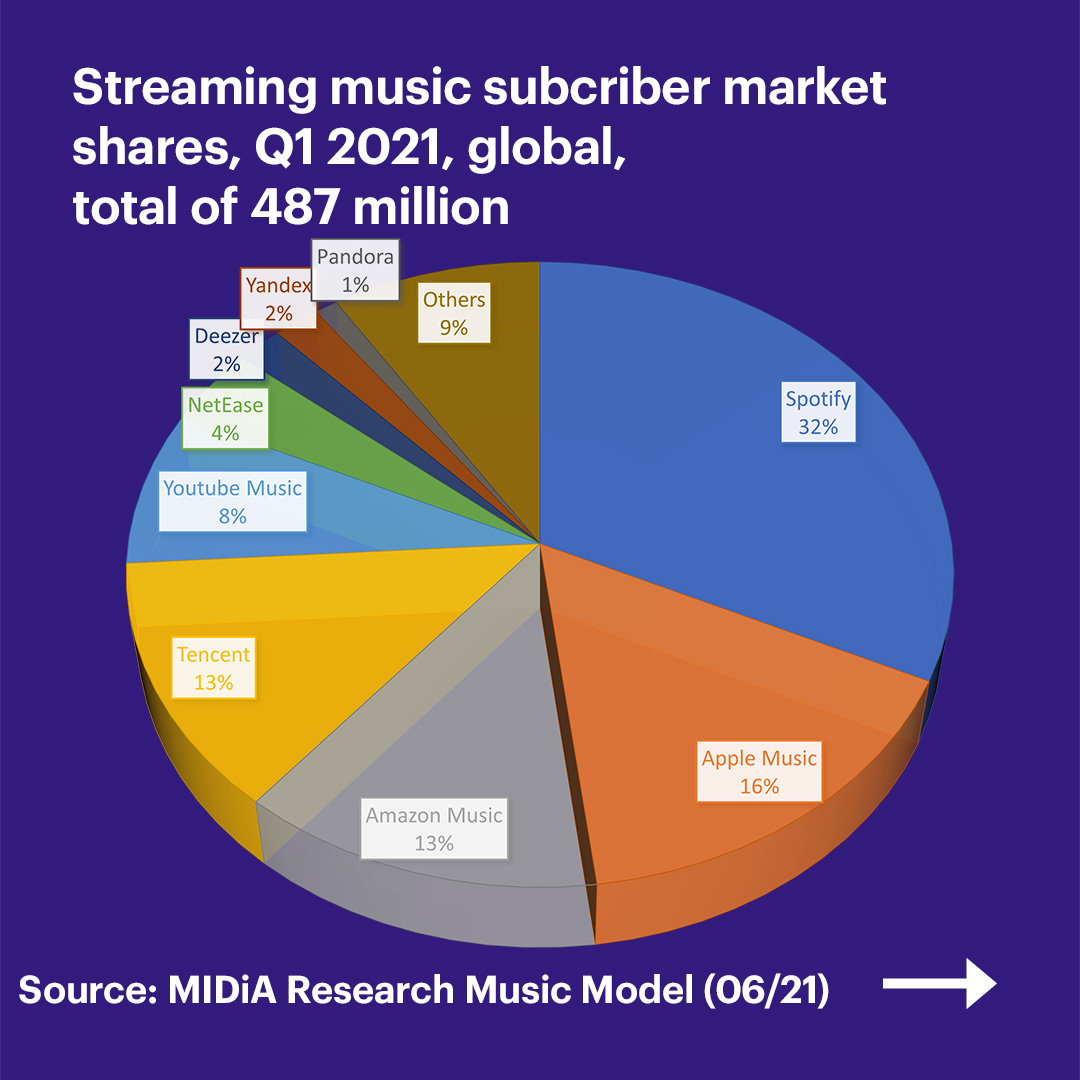
Worldwide, there are 487 million music listeners with a paid streaming subscription. There were 100 million new paying consumers joining in last year alone. More than a quarter of them opted for a Spotify subscription, which certainly also has something to do with Spotify’s recent expansion into different markets. Percentage-wise, however, YouTube Music, Tencent and Amazon experienced even higher growth. We’ve decided to take a closer look at how the streaming cake is cut.

Spotify clearly on top

The clear front runner is and continues to be Spotify, where 32% of the paying users can be found. Next in the rankings are Apple Music, Amazon, and Tencent, which together make up 42% of the paid subscriptions (Apple 16%, Amazon and Tencent 13% each). The remaining 26% are divided among YouTube Music (8%), Chinese provider NetEase (4%), Deezer and Yandex (2% each), Pandora (1%), as well as various other streaming platforms (9%).

Will the growth continue?

Last year’s growth of 100 million new subscribers surpasses that of 2019 by a long shot. Back then, the number of subscribers increased by 83 million. The numbers for the first quarter of 2021 are already out, as well, and show a growth of 19.5 million subscribers. Based on these figures, we can project a total of 78 million for the whole year. If the growth rate doesn’t increase, this would thus signify a clear downward trend compared to previous years.

Revenue doesn’t grow as fast as subscribers

Most of the growth comes from countries in Latin America, Asia, and other up-and-coming markets. This also explains why the revenues from subscriptions don’t grow as quickly as the number of subscribers, since most of these subscribers come from countries with lower subscription fees and ad revenues. You can learn more about how this affects the revenues for artists in our recent multi-part series on payouts per stream.

Strongest growth for YouTube Music

While Spotify saw a growth of only 20% and Apple Music even less with 12%, YouTube Music was able to increase theirs by an impressive 60%. Some analysts are already speculating that YouTube Music might be for Gen Z what Spotify was for millennials back in the day. We will definitely keep a close watch on the developments of both YouTube Music and the streaming market in general and keep you updated on the latest news and trends.

TikTok: Where new music is discovered

What you'll learn in this post:
  • More new music is discovered through TikTok than many streaming services
  • Why TikTok is great for discovery
  • Up to three-minute videos are now possible on TikTok

We have already pointed out last year that TikTok is a trendsetter in the music industry. Our new data has proven this once again and notably also shown that many listeners are discovering new songs via TikTok. So, it’s becoming harder and harder for musicians to ignore the video app completely. At the very least, you should make your music available on TikTok; even better if you are active on it yourself.

Surveys show: A lot of new music is discovered via TikTok

A survey conducted among 1,000 TikTok users showed that the respondents consider the app to be their second-most important tool for discovering new music. TikTok is still just behind Spotify but in front of YouTube, Apple Music, and SoundCloud. 40% of respondents also mentioned having discovered new music genres on TikTok. The two genres showing the most music discoveries are, rather unsurprisingly, hip hop and pop. Around half of the songs are found via the For You page.

TikTok conducted a similar survey among users from the UK, Germany, France, Spain, and Italy. Here, 80% of respondents indicated that they discovered new music via TikTok. 56% do so via the For You page. Because of this, TikTok is therefore convinced that many users also stream or buy the newly discovered songs afterwards. However, they cannot yet back this up with numbers. Still, in their view, users are discovering even more songs on TikTok than on other streaming services.

Short attention span?

One reason for this, is certainly that on TikTok, you can switch from one video to the next in a matter of seconds and thus also from one song to the next. Since the videos are only a maximum of 60 seconds long, listeners are immediately presented with the catchiest part of the track. However, the fact that you can listen to dozens of songs within a short period of time is certainly not conducive to the attention span.

But there is good news, as well: 84% of respondents actually added the newly discovered songs to a playlist so they can listen to them again later. This gives at least some indication that things are not as short-lived as they may seem at first glance.

New up to 3 minutes long videos on TikTok

Another factor which might counteract TikTok’s ephemerality is their plan to extend the maximum video length once more from 60 seconds to three minutes.

Considering that nowadays most songs tend to be shorter, in most cases, this would be enough time to fit an entire track into one video. With the change, TikTok can simultaneously become a direct challenge to YouTube. While many other social medial platforms are copying TikToks short video format, TikTok itself is taking a step in the opposite direction. It remains to be seen whether the users will take to this or whether they will prefer the bite-sized clips.

At iGroove, you can have your songs made available on TikTok so that people can use them in their videos. You will be paid for each video that contains your song and not based on the number of views that the videos generate.

Checklist: 10 things you need to do before your release

What you'll learn in this post:
  • What you should do before your release
  • The checklist with 10 points to tick off

When a new release is coming up, you naturally want it not only to be available for purchase, but also to be discovered, streamed, shared, and loved. We’ve already made a previous detailed post about how much time and especially how much planning goes into the making of an album. In this one, we want to list once again what all needs to be done before each release (including singles) in order to set up the best prerequisites for going public and for launching the promotion that goes with it.

Generally, the mastered audio file as well as the artwork are enough to release a song. But you should never release anything before checking off the following points:

  • Upload your song to your distributor’s page 2 weeks before the release at the latest – the earlier, the better. That way, you can be sure that it will appear in your fans’ release radar and you can pitch your track in time.
  • If your distributor gives you the option, definitely make sure that all the IDs are correctly stored on Spotify’s and Apple Music’s databases so that the release will appear in the correct artist profiles.
  • If you haven’t done so already: Claim your profile on Spotify, Apple Music, Deezer, Amazon, and YouTube and make sure to update them all.
  • Fire up the algorithms by setting up pre-saves on Spotify, Deezer, and Apple Music.
  • If the release has more than one song, you might want to consider instant gratification.
  • To avoid having to post all kinds of different links, set up a handy link page.
  • Make your songs available on YouTube, Instagram, Facebook, and TikTok, as well, and make some money whenever they’re shared.
  • Make sure that all your social media profiles as well as your website are up-to-date.
  • Create the graphic design and videos for your social media promotion well ahead of time. This goes for your Canvas on Spotify, too.
  • Register your release at the copyright collectives so you don’t miss out on any revenues.

Once you’ve checked off these 10 points, you’ve fulfilled all the basic prerequisites for a successful release. If you still have questions about your release or the promotion, our iGroove team will be happy to help.

How to verify your profile on Twitch

What you'll learn in this post:
  • What benefits you have as a Twitch partner
  • What criteria you must meet

Because of the pandemic, Twitch has become an increasingly important tool for musicians, as well, and for quite a few also a main source of income. Like many others, the Amazon-owned streaming platform, too, offers the option to verify your profile and thus profit from various features. We’ve summed up the most important information for you.

The advantages

With a verification, you can become a so-called Twitch-partner and profit from the following monetization options:

  • Twitch subscription: Users can pay money to subscribe to your channel
  • Ad revenues: As a Twitch partner, you can have ads on your channel and receive a share of the revenues they bring in (similar to YouTube)
  • Bits: Users can support you via the chat using so-called bits

Other benefits include:

  • Various customization options for your channel
  • VOD features
  • Access to a priority support team which will reply to you within 1-2 days
  • The option to put together your own stream teams
  • Being considered for special promotional opportunities
  • Video transcodes
  • Broadcast delay

The criteria

To apply for the partner program, you need to fulfil the following criteria:

  • You have streamed for a minimum of 25 hours within the last 30 days
  • You have streamed on 12 different days within the last 30 days
  • You have an average of 75 viewers within the last 30 days

Once these requirements are met, you can start your application via the dashboard. Normally, it will be reviewed within the next 7 days.

In some cases, it’s enough to have a strong and engaged following on other social media platforms.

PPS: Comparing Spotify, Apple, and Deezer

What you'll learn in this post:
  • The direct comparison between Spotify, Apple Music and Deezer
  • Which streaming service pays the most per stream
  • In which countries it differs from the norm

After we’ve shown you recently how greatly the Pay Per Stream (PPS) at Spotify, Apple Music, and Deezer can vary depending on the country, we will now compare the three streaming services directly. To sum up our findings briefly: Apple Music always pays more than Spotify. Deezer, too, always has a higher PPS than Spotify, except in Israel. And finally, with the exception of 8 countries, Apple always pays more than Deezer, as well.

Spotify vs. Apple Music

On average, Apple Music pays 2.63 times as much as Spotify. In our last assessment, it was 2.84 times as much. In most countries, we observe a factor ranging between 1.5 and 2.5. In various Balkan states and in Jordan, it can even be between 6.34 (Serbia) and 10.43 (Macedonia). In the English-speaking countries, the factor is always below average and ranges from 1.54 (USA) and 2.29 (Ireland).

Spotify vs. Deezer

These two services are easy to compare, since both have a premium subscription as well as a free subscription option. In most countries, Deezer’s PPS is at most twice as high as Spotify’s. In 16 countries, you even get more than double the amount per stream, primarily in Eastern European countries but also in the US. Aside from the US with its factor of 2.63, the other English-speaking countries are either average or slightly below average.

Apple Music vs. Deezer

As expected, you will receive more at Apple Music than at Deezer, since the former does without a free subscription option. However, it is only 38% more on average. In 8 of the countries we examined, you even get more per stream at Deezer than at Apple Music. In most countries, the difference is not too big. Only in Jordan, Italy, Macedonia, Bosnia, and Israel you’ll find a factor higher than 3. In the UK and Ireland, the factor is slightly above average, in Australia you would get approximately the same amount from either service, while for streams from the US and Canada, Deezer actually pays better than Apple Music.

For those who find these PPs numbers and factors to be too abstract, we present the concrete comparison between the English-speaking countries. For one million streams you would receive the following amount of money (in USD) in each country:

All figures in USD / Status June 2021
 SpotifyApple MusicDeezer
Australia4,2288,0497,986
Canada2,9995,4115,555
Ireland5,37012,2787,954
New Zealand4,8209,8377,854
UK5,82211,3027,838
USA3,9746,11310,465

The next table shows you how many streams it takes from each country to get to USD 4,000:

Status June 2021
 SpotifyApple MusicDeezer
Australia946k497k501k
Canada1.334 Mio.739k720k
Ireland745k326k503k
New Zealand830k407k509k
UK687k354k510k
USA1.007 Mio.654k382k

The comparison clearly shows that it takes a much greater number of streams on Spotify to receive a good amount of money. But since Spotify has significantly more users than its two competitors, most musicians still receive their biggest share from Spotify.

Here you can find the complete assessment covering 45 countries:

All figures in USD / Status June 2021
CountryDeezer per MillionSpotify per MillionApple Music per MillionDeezer vs. SpotifyApple vs. DeezerApple vs. Spotify
Australia7,986.274,227.908,049.191.891.011.90
Austria8,104.174,114.999,139.211.971.132.22
Azerbaijan1,229.65621.913,137.051.982.555.04
Belgium6,661.313,486.428,079.841.911.212.31
Bosnia and Herzegovina1,652.58639.885,521.802.583.348.63
Canada5,555.392,998.745,410.781.850.971.80
Chile3,038.731,113.743,293.082.731.082.96
Colombia2,813.89943.892,481.972.980.882.63
Czech Republic4,263.882,331.515,939.461.831.392.55
Denmark10,958.155,491.2612,220.662.001.112.23
Finland9,576.105,414.5911,092.601.771.162.05
France5,661.923,516.626,960.261.611.231.98
Germany5,766.493,816.477,013.451.511.221.84
Greece5,166.142,052.028,635.162.521.674.21
Hungary6,166.102,003.154,637.213.080.752.31
Ireland7,954.485,369.912,278.361.481.542.29
Israel1,507.973,297.394,882.730.463.241.48
Italy2,336.812,272.59,397.361.034.024.14
Jordan1,465.25837.298,558.061.755.8410.22
Kazakhstan4,321.11621.291,724.416.960.402.78
Luxembourg7,033.164,629.6910,109.951.521.442.18
Macedonia2,139.11706.007,363.643.033.4410.43
Mexico2,332.801,235.812,927.111.891.252.37
Montenegro5,957.46795.945,690.947.480.967.15
Netherlands7,019.474,357.4512,332.701.611.762.83
New Zealand7,853.644,820.449,837.481.631.252.04
Norway10,013.435,459.8016,405.431.831.643.00
Peru1,875.191,120.542,555.401.671.362.28
Philippines1,472.99802.703,253.711.842.214.05
Poland3,632.631,521.364,639.032.391.283.05
Portugal3,634.321,881.237,104.271.931.953.78
Romania4,136.481,986.74,370.602.081.062.20
Russia1,880.37642.062,187.362.931.163.41
Serbia and Montenegro4,092.71973.646,177.644.201.516.34
Slovakia3,770.361,976.406,572.991.911.743.33
Slovenia3,898.851,265.914,576.563.081.173.62
South Africa3,423.171,702.143,111.812.010.911.83
Spain3,795.092,396.318,175.531.582.153.41
Sweden6,978.384,955.3510,888.191.411.562.20
Switzerland7,117.005,377.0610,778.581.321.512.00
Thailand4,911.321,158.884,409.314.240.903.80
Turkey1,036.29594.282,774.491.742.684.67
Ukraine3,332.50838.783,556.063.971.074.24
United Kingdom7,838.335821.5311,302.161.351.441.94
United States10,464.623,974.476,113.302.630.581.54

How much do I get per stream on Deezer?

What you'll learn in this post:
  • For which countries Deezer pays the highest PPS per streams
  • How much Deezer pays per stream. Broken down to 66 countries
  • Why Deezer wants to switch to user-centric, though it's not quite as simple

After our recent assessment of Spotify’s and Apple Music’s numbers, we have now analyzed Deezer’s Pay Per Stream (PPS) for the first time. Here too, we aim to show you how much influence the origin of a stream can have on the payout. It is not much of a surprise that Deezer’s numbers, too, vary greatly from country to country.

Surprising frontrunner

We were rather taken aback to see which country showed the highest PPS: Bulgaria is on first place by quite a large margin – this despite the fact that it can only be found somewhere in the midrange at Spotify. We are already curious to see whether this will be reaffirmed in our next assessment or whether this is just a single outlier.

What also stands out is that a whopping three Arabic countries, Qatar, UAE, and Saudi Arabia, are among the top 10. The Ivory Coast, meanwhile, represents Africa in the top 15. Apart from these, you’ll find some of the usual suspects in the front rows, such as the US, Austria, and the Scandinavian countries. As is the case at Spotify, Turkey is again at the back of the list, as are various Asian, African, and Latin American states.

The English-speaking countries in comparison

In contrast to Spotify and Apple Music, Deezer sees the US rank first among the English-speaking countries. While Australia, Ireland, New Zealand, and the UK are pretty much neck and neck, Canada, as we’ve also seen before, brings up the rear.

USA10,464.62
Australia7,986.27
Ireland7,954.48
New Zealand7,853.64
United Kingdom7,838.33
Canada5,555.39

PPS twice as high as Spotify’s

Assuming you had the same number of streams in each of the 66 countries we assessed, you would receive $4,776 per one million streams. Even though Deezer offers add-supported subscriptions, as well, their PPS is about twice as high as Spotify’s and only around 25% lower than Apple Music’s. We will compare these three streaming services in more detail in an upcoming post.

Deezer wants user-centric model

In a recently released video, Deezer’s CEO emphasizes once again that his company absolutely wants to make a switch to the user-centric distribution model. However, he also points out that this will not be possible without the labels, distributors, artists, and fans. He is therefore asking for people’s support for this model that Deezer views to be fairer and more transparent. It will definitely be interesting to see what impact a system change would have on the PPS.

The PPS of 66 countries in comparison

Here you can find the complete list with all 66 evaluated countries. For each country you can see the Pay Per Stream (PPS) as well as the extrapolation of how much you get for one million streams from the respective country.

All figures in USD / Status June 2021
CountryPPSPer Million
Bulgaria0.01487667514,876.68
Denmark0.01095814910,958.15
Qatar0.01064594810,645.95
USA0.01046461610,464.62
United Arab Emirates0.01017622810,176.23
Norway0.01001343110,013.43
Saudi Arabia0.0099835579,983.56
Finland0.00957619,576.10
Austria0.0081041748,104.17
Australia0.0079862677,986.27
Ireland0.0079544847,954.48
New Zealand0.007853647,853.64
United Kingdom0.0078383317,838.33
Côte d'Ivoire0.0072813177,281.32
Switzerland0.0071169997,117.00
Luxembourg0.0070331567,033.16
Netherlands0.0070194727,019.47
Sweden0.0069783786,978.38
Belgium0.0066613086,661.31
Hungary0.0061660986,166.10
Montenegro0.0059574595,957.46
Germany0.0057664855,766.49
France0.0056619235,661.92
Canada0.0055553885,555.39
Greece0.0051661365,166.14
Thailand0.0049113184,911.32
Egypt0.0045451964,545.20
Mauritius0.0043356174,335.62
Kazakhstan0.0043211064,321.11
Czech Republic0.0042638814,263.88
Romania0.0041364834,136.48
Serbia and Montenegro0.0040927074,092.71
Slovenia0.0038988523,898.85
Spain0.0037950953,795.09
Slovakia0.0037703623,770.36
Paraguay0.0036893223,689.32
Croatia0.0036737863,673.79
Portugal0.0036343243,634.32
Poland0.0036326253,632.63
Guatemala0.0036188733,618.87
South Africa0.0034231683,423.17
Ukraine0.0033325033,332.50
Chile0.0030387353,038.73
Ecuador0.0029858892,985.89
Colombia0.0028138922,813.89
Kenya0.0026770812,677.08
Italy0.002336812,336.81
Mexico0.0023328012,332.80
Bolivia0.0022604122,260.41
Macedonia0.0021391152,139.11
Albania0.0019784781,978.48
Costa Rica0.0018914531,891.45
Russia0.0018803721,880.37
Peru0.0018751911,875.19
Morocco0.0017995361,799.54
Nigeria0.0017090871,709.09
Bosnia and Herzegovina0.0016525841,652.58
Argentina0.0015823321,582.33
Israel0.0015079711,507.97
Philippines0.0014729891,472.99
Jordan0.001465251,465.25
El Salvador0.0013321341,332.13
Azerbaijan0.0012296461,229.65
Brazil0.0011974671,197.47
Algeria0.0011699971,170.00
Turkey0.0010362931,036.29

How much do I get per stream on Apple Music? – 2021 edition

What you'll learn in this post:
  • If Apple Music really pays the announced $0.01 per stream
  • How much Apple Music pays per stream. Broken down to 81 countries
  • How much you get for a million streams from the US or UK

Just as we did recently with Spotify, we have now given our Apple Music assessment from last year an update, too. The reasons are the same as the ones for Spotify: One, the Pay per Stream (PPS) is always fluctuating, and two, there were some more countries to add here, as well.

The assessment can help you to determine which countries you could step up your marketing game in but also to better understand how Apple Music pays you as an artist.

PPS below the announced $0.01

Apple Music has recently mentioned in an announcement that their PPS is at $0.01. However, this number only takes standard subscriptions into account, and not any of the cheaper ones, e.g., family subscriptions. They also add up the payouts for the master and publishing rights, while our assessment is solely focused on the payout for the copyright owners, which will then be forwarded to the artists via the distributor.

Even though Apple Music clearly pays more per stream than the majority of their competitors, they are still pretty far away from those $0.01.

On average across all countries, Apple Music pays $0.00599265 per stream. As mentioned above, this number only accounts for the master rights, which make up 52% of the generated revenues. If we add the 14.7% that are paid out for the publishing rights, we would thus get $0,0077.

Based on our calculations, it is only the top 23 countries that, when combining master and publishing rights, receive $0.01 or more per stream. For the US, Canada, Germany, or France, for instance, this is not the case.

PPS decreased in majority

Generally speaking, our new assessment has shown that the PPS in most countries has decreased since our last assessment. In many states this difference is only minimal, but in others it is in the double digits. The countries suffering the biggest losses are, among others, Japan, Portugal, Indonesia, the US, Hong Kong, China, Chile, and, as it was the case with Spotify, Turkey.

The average payout across all countries has decreased, as well. In our last assessment, we calculated $6,872 for one million streams. Now, however, if you had the same number of streams in all the countries we examined, you would get only $5,992.65. The reasons for this are, on the one hand, as we already mentioned, the decreasing PPS in many countries, but on the other also the fact that we included 30 additional countries in our assessment this year.

Northern European countries on top

The decidedly biggest payout can be observed in Norway. The other Scandinavian countries, too, are among the top 10 along with the Netherlands, Ireland, the UK and Switzerland. While a majority of Central European countries can be found at the top also, the other end of the list is made up of African, Asian, and Eastern European countries, as well as a few Latin American countries. The US and notably Canada only fall into the midrange.

The English-speaking countries in comparison

If we only compare the English-speaking countries, we can see that the differences here are even more massive than at Spotify. In Ireland and the UK, you get about twice as much per stream than you do in the US and Canada, while New Zealand and Australia are sitting somewhere in between.

Ireland12,278.36
UK11,302.16
New Zealand9,837.48
Australia8,049.19
USA6,113.30
Canada5,410.78

The PPS of 81 countries in comparison

Here you can find the complete list with the 81 evaluated countries. For each country you can see the Pay Per Stream (PPS) as well as the extrapolation of how much you get for one million streams from the respective country. In addition, you can see how high the number for one million streams was in our last evaluation and how high the percentual change is.

All figures in USD / Status June 2021
CountryPPSPer Million StreamsAnalysis 2020Changes %
Norway0.0164054316,405.4315,847.233.52
Netherlands0.01233269812,332.7010,636.2215.95
Ireland0.01227835812,278.36
Kuwait0.01226725312,267.25
Denmark0.0122206612,220.6613,162.59-7.16
United Kingdom0.01130216111,302.1611,493.02-1.66
Finland0.01109259711,092.6011,715.55-5.32
Sweden0.01088819210,888.1912,341.49-11.78
Switzerland0.0107785810,778.5811,274.06-4.39
Cyprus0.0103638810,363.88
Luxembourg0.01010995410,109.9511,595.36-12.81
New Zealand0.0098374799,837.489,222.56.67
Malta0.0097893049,789.30
Oman0.009665019,665.01
Italy0.009397369,397.3610,651.69-11.78
Austria0.0091392129,139.219,696.12-5.74
Greece0.0086351568,635.168,671.53-0.42
Jordan0.0085580628,558.06
Lithuania0.0082767258,276.72
Spain0.0081755328,175.539,312.94-12.21
Bahrain0.0081718538,171.85
Belgium0.0080798418,079.849,109.45-11.30
Australia0.008049198,049.198,244.32-2.37
Japan0.0075643967,564.409,242.73-18.16
Singapore0.0074113357,411.349,192.75-19.38
Macedonia0.0073636377,363.64
Portugal0.0071042697,104.279,497.39-25.20
Germany0.0070134537,013.456,990.060.33
France0.0069602656,960.267,787.36-10.62
Estonia0.006931016,931.01
Slovakia0.0065729856,572.996,374.833.11
Indonesia0.0062600396,260.044,883.7628.18
Serbia and Montenegro0.0061776416,177.64
USA0.0061132976,113.307,626.71-19.84
Hong Kong0.0060550736,055.077,873.04-23.09
Czech Republic0.0059394555,939.465,861.941.32
Belarus0.0058895685,889.57
Latvia0.0057406915,740.69
Montenegro0.0056909435,690.94
Lebanon0.0056043135,604.31
Bosnia and Herzegovina0.0055217985,521.80
Canada0.0054107825,410.785,428.78-0.33
Macao0.0051556435,155.64
Israel0.0048827264,882.735,656.07-13.67
Malaysia0.0048588594,858.864,247.1114.40
Armenia0.0046464794,646.48
Poland0.0046390334,639.034,968.25-6.62
Hungary0.0046372134,637.215,274.08-12.08
Slovenia0.004576564,576.564,813.55-4.92
Georgia0.0044714354,471.43
Thailand0.0044093074,409.314,696.93-6.12
Romania0.0043705994,370.605,043.22-13.33
China0.0043451174,345.126,114.22-28.93
Mozambique0.0043012634,301.26
Taiwan0.0039944863,994.494,557.7-12.36
Sri Lanka0.0039806173,980.62
Mongolia0.0037260073,726.01
Mauritius0.0036338683,633.87
Ukraine0.0035560623,556.063,592.61-1.02
Moldova0.0034908453,490.84
Namibia0.0033355393,335.54
Chile0.0032930793,293.084,523.19-27.20
Philippines0.003253713,253.713,816.33-14.74
Azerbaijan0.0031370463,137.05
Vietnam0.0031298123,129.81
South Africa0.003111813,111.812,866.718.55
Mexico0.0029271072,927.112,994.04-2.24
Turkey0.0027744852,774.493,515.26-21.07
Kyrgyzstan0.0027523872,752.39
Peru0.0025553962,555.403,147.55-18.81
Colombia0.0024819652,481.972,602.53-4.63
Cambodia0.0024611582,461.16
Kenya0.0021930562,193.06
Russia0.0021873592,187.362,383.57-8.23
Botswana0.0020682782,068.28
Uganda0.0019258751,925.88
India0.001893841,893.842,299.08-17.63
Kazakhstan0.0017244151,724.412,058.7-16.24
Zambia0.0014001661,400.17
Ghana0.0011190941,119.09
Nigeria0.000863615863.621,288.77-32.99

How much do I get per stream on Spotify? – 2021 edition

What you'll learn in this post:
  • How much Spotify pays per stream. Broken down to 94 countries
  • How much you get for a million streams from the US or UK
  • Why South Korea is clearly the frontrunner

It has been almost a year since we last examined how much Spotify pays per stream and thus showed how extremely dependent these numbers are on the country from which each stream originates.

Since the numbers are constantly changing and there have been more and more new countries being added, we have once again analyzed mountains of data to deliver you the 2021 update on Spotify’s Pay Per Stream (PPS).

The goal of the assessment is firstly to help understand Spotify’s payout system. However, additionally, it can also give some indication on which countries might be well worth an additional marketing campaign launch. Obviously, in these deliberations, you should always consider the population figure as well, and not just whether the PPS is particularly high or low.

PPS increased in majority

The good news is that the PPS in many countries has increased since our last assessment. The bad news is that it has mostly decreased in countries where it was already low before. This primarily affects countries in Asia, Africa, and Latin America. But in most European and North American countries, the PPS is higher now than it was during our last analysis.

The average across all countries has slightly decreased, but this is mainly due to the fact that Spotify is now available in various new states, most of which have low subscription fees (as well as low ad revenues), and thus also a low PPS. If we assume that you had an equal number of streams in each of the analyzed countries, then you would receive 2,354.56 USD for one million streams. In our last assessment, this average figure was at 2,389.58

In addition, we did not include some countries in which Spotify is also available because we did not have enough data. In total, we analyzed the data from 94 countries, with the addition of various Eastern European countries.

South Korea and UK are the frontrunners

The clear frontrunner is South Korea with a PPS three times as high as that of the UK sitting second place. The reason for this is that there is no free option for Spotify in Korea, only premium subscriptions. Thus, it becomes clear what immense influence the free tier has on the PPS and also why Apple Music, for instance, pays so much more per stream than Spotify does. Other than the UK, the top ranks are exclusively made up of European countries, primarily from Northern Europe, as well as Switzerland, Ireland, and the microstates Monaco and Liechtenstein.

The losers

The country that suffers the most losses is Turkey, where the PPS has sunk by a whopping 30% since our last assessment. Now, Turkey is sitting on last place when compared to all the countries we examined. Other low ranks include various Eastern European countries, North African states, and Argentina.

The English-speaking countries in comparison

How big the deviations are from country to country becomes apparent if you look at the comparison between the English-speaking countries alone:

UK5,821.53
Ireland5,369.90
New Zealand4,820.44
Australia4,227.90
USA3,974.47
Canada2,998.74

So, in the UK you would receive almost twice as much per stream than you would in Canada, for example, or 46% more than you would in the US.

The PPS of 94 countries in comparison

Here you can find the complete list with the 94 evaluated countries. For each country you can see the Pay Per Stream (PPS) as well as the extrapolation of how much you get for one million streams from the respective country. In addition, you can see how high the number for one million streams was in our last evaluation and how high the percentual change is.

All figures in USD / Status June 2021
CountryPPSPer Million StreamsAnalysis 2020Change in %
South Korea0.01786038812917,860.39
United Kingdom0.0058215330445,821.534,968.8517.16
Denmark0.0054912574005,491.265,218.465.23
Iceland0.0054613477315,461.356,253.90-12.67
Norway0.0054597990095,459.805,542.20-1.49
Monaco0.0054362844875,436.285,275.023.06
Finland0.0054145938565,414.594,496.1120.43
Switzerland0.0053770623795,377.064,790.2912.25
Ireland0.0053699026485,369.904,624.8316.11
Liechtenstein0.0050045980205,004.604,777.974.74
Sweden0.0049553532454,955.354,456.0911.20
New Zealand0.0048204366384,820.445,035.01-4.26
Luxembourg0.0046296891274,629.694,207.2810.04
Andorra0.0044311644024,431.163,636.1821.86
Netherlands0.0043574491814,357.453,668.6518.78
Australia0.0042278973184,227.904,010.355.42
Austria0.0041149917044,114.994,468.43-7.91
USA0.0039744688263,974.473,567.1411.42
Germany0.0038164684413,816.473,406.0712.05
Japan0.0037407284193,740.733,589.904.20
France0.0035166205153,516.623,201.509.84
Belgium0.0034864231113,486.423,281.976.23
Cyprus0.0033045575833,304.563,075.317.45
Israel0.0032973888153,297.393,320.64-0.70
Hong Kong0.0032472800733,247.282,774.9117.02
Estonia0.0030387769863,038.782,719.2311.75
Canada0.0029987427302,998.742,770.098.25
Malta0.0028361218242,836.122,794.451.49
Singapore0.0025097621052,509.762,950.14-14.93
United Arab Emirates0.0024201928682,420.192,556.12-5.32
Spain0.0023963136772,396.312,378.300.76
Czech Republic0.0023315077642,331.512,130.779.42
Italy0.0022725028682,272.502,016.4112.70
Lithuania0.0021736039622,173.602,093.443.83
Greece0.0020520152332,052.021,790.0114.64
Hungary0.0020031509292,003.151,926.223.99
Romania0.0019867011041,986.701,532.6829.62
Slovakia0.0019763958111,976.401,951.081.30
Uruguay0.0018937497651,893.752,517.41-24.77
Portugal0.0018812349981,881.231,644.6214.39
Latvia0.0018461779241,846.181,793.732.92
Qatar0.0018002871301,800.291,470.4822.43
Oman0.0017587424051,758.741,878.31-6.37
Lebanon0.0017427379081,742.742,054.46-15.17
Bahrain0.0017070710981,707.071,788.01-4.53
Costa Rica0.0017025114211,702.511,998.53-14.81
South Africa0.0017021383731,702.141,586.987.26
Dominican Republic0.0016352677201,635.271,911.83-14.47
Panama0.0016254796241,625.482,938.55-44.68
Bulgaria0.0016117442281,611.741,617.98-0.39
Poland0.0015213628161,521.361,421.327.04
Kuwait0.0015103979631,510.401,464.563.13
Saudi Arabia0.0015074404971,507.441,040.8544.83
Taiwan0.0014724358821,472.441,533.33-3.97
Ecuador0.0014332568881,433.261,658.31-13.57
Croatia0.0014318023371,431.80
Slovenia0.0012659148091,265.91
India0.0012548786911,254.881,424.51-11.91
Mexico0.0012358082401,235.811,457.69-15.22
Malaysia0.0012323903821,232.391,570.98-21.55
Nicaragua0.0012042340701,204.231,239.84-2.87
Vietnam0.0011778586881,177.861,651.53-28.68
Thailand0.0011588794221,158.881,175.36-1.40
Brazil0.0011502192271,150.221,309.48-12.16
Peru0.0011205374611,120.541,478.11-24.19
Chile0.0011137374851,113.741,276.45-12.75
Honduras0.0011101355731,110.141,740.34-36.21
El Salvador0.0010855846031,085.581,485.72-26.93
Guatemala0.0010477970851,047.801,184.13-11.51
Serbia and Montenegro0.000973640242973.64
Moldova0.000962343080962.34
Colombia0.000943889656943.891,061.79-11.10
Egypt0.000928249723928.25980.39-5.32
Palestine0.000874395435874.40988.56-11.55
Ukraine0.000838780258838.78
Jordan0.000837291178837.291005.29-16.71
Bolivia0.000831138432831.141,005.87-17.37
Philippines0.000802704758802.70823.36-2.51
Montenegro0.000795939228795.94
Morocco0.000759186316759.19809.50-6.22
Paraguay0.000743657959743.661,556.01-52.21
Indonesia0.000728434289728.43974.90-25.28
Macedonia0.000705997809706.00
Argentina0.000702836241702.84859.80-18.26
Belarus0.000668329386668.33
Tunisia0.000662118175662.12710.60-6.82
Algeria0.000661773102661.77712.67-7.14
Russia0.000642055867642.06
Bosnia and Herzegovina0.000639883319639.88
Azerbaijan0.000621906031621.91
Mongolia0.000621691097621.69
Kazakhstan0.000621291077621.29
Albania0.000611085058611.09
Turkey0.000594278777594.28851.40-30.20

Instagram’s algorithms

What you'll learn in this post:
  • According to which criteria the algorithm decides which posts are displayed to whom
  • How the algorithms differ for Feed, Stories, Reels, and Explore
  • Why you should therefore use different strategies

As a musician, you are often dependent on tools made available by tech giants like Spotify, Apple, Amazon, Facebook, or Google – all companies that are not necessarily known for their exorbitant transparency. Therefore, it often takes external pressure before those companies give some more insight into their process, like Spotify and Apple Music recently did. Instagram seems to have felt this pressure, as well, as they have now divulged some information concerning their algorithm.

The first thing they make clear is that they don’t have just one algorithm but that there are different ones at work, each with their own function. When Instagram was launched in 2010, they showed all the posts in chronological order. The more users and the more content showed up, however, the more difficult this became. In 2016, users supposedly missed 70% of the posts in their feed, including half of the posts made by their closest friends.

Because of this, the feed was adjusted to show those posts that interest the user the most (or rather, that the algorithm in charge speculates interest the user the most). Every part of the app, from the Feed to the Search to the Reels, has its own algorithm based on user behavior for each. Here, we’ve put together the deciding criteria for you.

Feed & Stories

Here, the algorithm places its focus on friends, family, and generally people that the user is closest with. That’s why, with the exception of ads, the feed and stories primarily feature the newest posts from the people that the user follows. According to Instagram, which posts and Stories are effectively shown is determined based on thousands of signals. Broadly summarized, these include:

  • Information about the post: Content, length, popularity, time, and place
  • Information about the person who posted it: The algorithm will try to find out how important this person is based on the interactions that have occurred in the past weeks.
  • User activity: Based on these, the algorithm identifies what the user is interested in, for instance by seeing what posts they’ve given a like
  • Interactions: This is supposed to show how interested the user is in the posts of a particular person. It’s based, among others, on how much the user has commented on their past posts.

Thus, the user is shown the posts and Stories where the algorithm senses the highest chance of an interaction. What qualifies as an interaction is how long the user looks at a post, and whether they like, comment, save, or tap on the profile photo. The algorithm is also careful not to show too many posts from the same person in a row.

Explore

Unlike the Feed and Stories, the Explore page does not show posts from people that a user follows, but introduces brand new content instead. In order to do that, Instagram analyzes what posts the user has liked or saved before. After that, similar photos and videos are filtered out and finally sorted according to how high the chances are that the user will interact with them.

These are the criteria, listed in order of importance:

  • Information about the post: This carries a bigger weight when it comes to the Explore page.
  • Interactions: Even though the user doesn’t know the person and doesn’t follow them, there still might have been interactions between them that are taken into account.
  • User activity: Here the interactions in the Explore Tab are taken into account, that is, what posts the user has previously looked at, liked, or saved.
  • Information about the person who made the post: The algorithm sees how many people have interacted with this person and finds out how interesting their posts are for others, as well.

Reels

When it comes to Reels, the focus lies primarily on entertainment. Most of the content here, too, comes from accounts that the user does not follow. So, the process of the algorithm is comparable to the search function, but much more heavily aimed at entertainment. The algorithm tries to determine which Reels a user might watch all the way through or which might even encourage them to visit the audio page where they might make their own Reel using the song that was used.

The most important signals here are:

  • User activity: Which Reels have they watched, liked, or commented on?
  • Interactions: Similar to the Explore page
  • Information about the Reel: Information about the content, the song that is used in it, as well as the popularity of the Reel
  • Information about the person who made the post: I.e., popularity

Instagram makes it clear that they cannot promise that every post will reach the same number of people. According to them, it is a simple fact that a majority of someone’s followers will not see a post they’ve made. This is apparently because most users look at less than half of their feed. Of course, the algorithm also predetermines what is being shown at all.

Just as there are different algorithms, as a musician you will also need different strategies. Reels should be utilized especially to reach potential new fans. What’s important here is, once again, the entertainment value.

With posts and Stories, on the other hand, you are primarily catering towards your existing fanbase. What all of the features have in common is that you always have to think about what might incite the most interactions which might then be picked up by the algorithm.